
Introduction
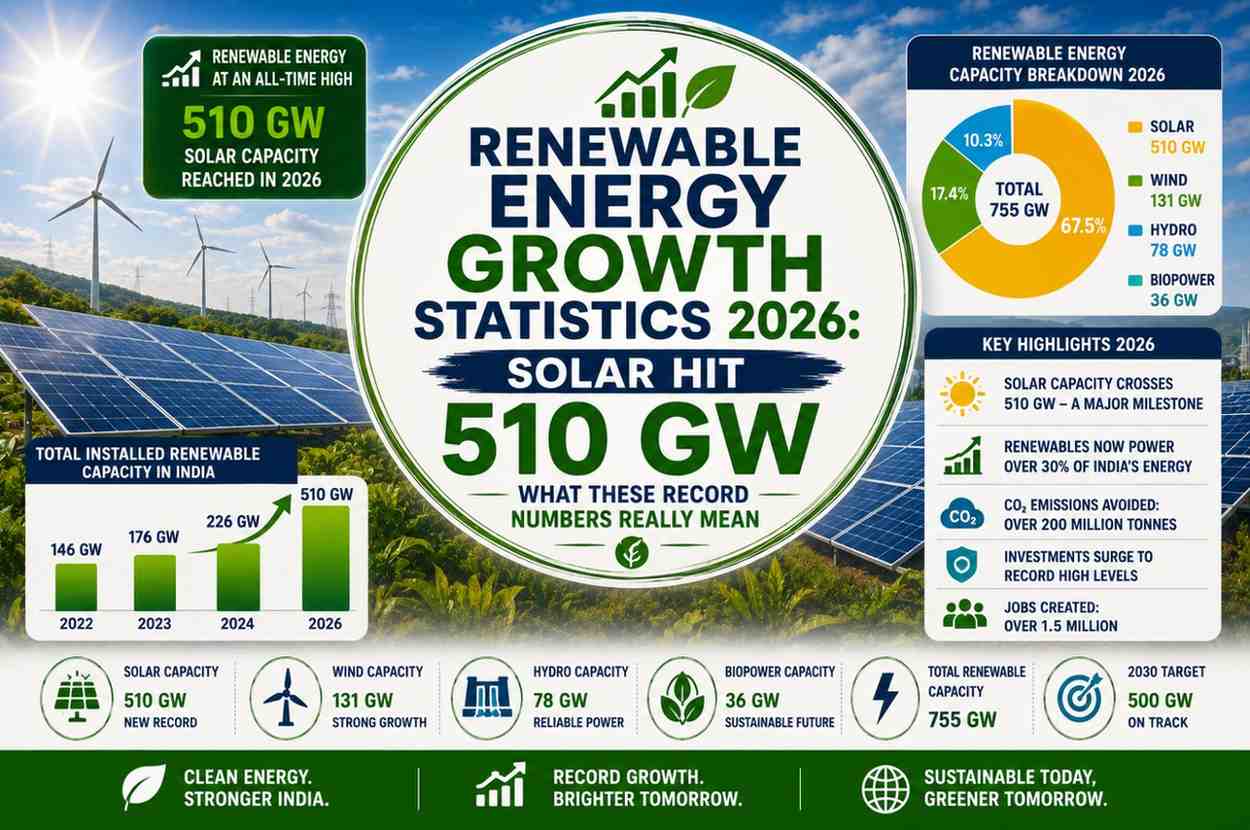
The renewable energy growth statistics for 2026 tell a story that would have been unimaginable a decade ago. Solar panel installations exceeded 510 GW in a single year. Renewables now generate over 35% of global electricity. Clean energy investment hit $2 trillion for the first time in history.
But what do these numbers actually mean for the energy transition? And are we moving fast enough?
This deep dive into renewable energy growth statistics for 2026 puts the records in context—with real data, honest analysis, and what the numbers tell us about where we’re headed.
Solar Power: The Headline Number
The most dramatic of all renewable energy growth statistics for 2026 is solar photovoltaic installation.
In 2024, the world added approximately 450 GW of new solar capacity. By 2026, this figure has accelerated to an estimated 510+ GW in a single calendar year.
To put that in perspective:
- 510 GW of solar is approximately 170 new large coal power plants’ worth of nameplate capacity added in 12 months
- Total global solar capacity is now approaching 3,000 GW
- Solar now generates more electricity annually than all of Africa’s total electricity demand
The renewable energy growth statistics for 2026 for solar represent the fastest deployment of any energy technology in human history.
What’s Driving Solar’s Record Growth?
- Panel prices fell another 15–20% in 2025 due to massive Chinese manufacturing scale
- Government incentives in the US (IRA), EU (Green Deal), India (PM Surya Ghar), and China
- Corporate renewable energy procurement at record levels
- Distributed rooftop solar growing rapidly in India, Southeast Asia, and Africa
- Utility-scale solar parks becoming the lowest-cost power source in most markets
Wind Energy Growth Statistics 2026
Wind capacity additions in 2026 reached an estimated 130–150 GW globally—another record year.
Key wind energy growth statistics 2026:
- Total global wind capacity: approximately 2,200 GW
- Offshore wind additions doubled from 2023 levels
- China added more offshore wind in 2025 than the rest of the world combined
- India added ~8 GW of wind in 2026, on track for 140 GW total by 2032
The offshore wind sector is the fastest-growing segment within wind, with projects now commissioned off the coasts of the UK, Netherlands, Taiwan, South Korea, and increasingly India.
Total Renewable Energy Capacity 2026
Looking at the broader renewable energy growth statistics 2026:
| Source | Global Installed Capacity (2026 est.) | % of Global Electricity |
|---|---|---|
| Solar PV | ~2,950 GW | ~12% |
| Wind (total) | ~2,200 GW | ~8% |
| Hydropower | ~1,450 GW | ~15% |
| Bioenergy | ~140 GW | ~2% |
| Geothermal | ~16 GW | <1% |
| Total Renewables | ~6,756 GW | ~37% |
Renewables now supply more than one-third of global electricity — a milestone that seemed distant just five years ago.
Investment Statistics: $2 Trillion and Counting
The renewable energy growth statistics for 2026 on investment are equally striking:
- Global clean energy investment in 2025: $1.97 trillion (nearly hitting the $2 trillion mark)
- For the first time, clean energy investment exceeded fossil fuel investment globally
- Solar attracted the largest share: approximately $450 billion
- Developing world clean energy investment grew 28% year-on-year
- India’s renewable energy investment reached approximately $25 billion in 2025
The financial system is increasingly aligned with clean energy. Major banks and institutional investors have shifted capital away from fossil fuel expansion and into renewable energy at an accelerating pace.
India’s Renewable Energy Growth Statistics 2026
India deserves special focus in any analysis of renewable energy growth statistics in 2026:
- Total installed renewable capacity: approximately 220 GW (exceeding coal capacity for the first time)
- Solar: ~115 GW installed
- Wind: ~47 GW installed
- Target: 500 GW by 2030 — on track
- Renewables share of India’s electricity: approximately 23%
India added more solar capacity in 2025 than any country except China—a remarkable achievement for a developing economy navigating energy access demands.
What the Statistics Don’t Tell You
An honest analysis of renewable energy growth statistics for 2026 must acknowledge the gaps:
- Electricity is only ~20% of total energy use—the rest is heat, transport, and industry
- Coal use globally has not significantly declined—total electricity demand is growing faster than renewables can replace
- Grid infrastructure investment is lagging—transmission bottlenecks limit renewable integration
- Storage deployment is accelerating but still insufficient for a fully renewable grid
- Industrial decarbonization (steel, cement, chemicals) remains largely unaddressed
The renewable energy statistics are genuinely impressive. But they must be read against the urgency of the climate timeline.
The Outlook: Can the Growth Rate Continue?
The most optimistic reading of renewable energy growth statistics for 2026 is that exponential growth curves, once established, can continue far longer than expected.
Solar panel manufacturing capacity is now so large that annual additions of 600–700 GW are foreseeable by 2028. Battery storage is following the same curve. Green hydrogen is beginning the same trajectory.
The IEA’s base case scenario now shows renewables supplying over 60% of global electricity by 2030.
Related Article: AI and Renewable Energy 2026 — How AI Is Supercharging the Clean Energy Revolution
External Resources
FAQ: Renewable Energy Growth Statistics 2026
Q1: How much solar was installed globally in 2026? An estimated 510+ GW of new solar capacity was added globally in 2026, the highest annual figure ever recorded.
Q2: What percentage of global electricity comes from renewables in 2026? Renewables now supply approximately 37% of global electricity generation, including solar, wind, hydro, and other clean sources.
Q3: How much has India invested in renewable energy? India’s renewable energy investment reached approximately $25 billion in 2025, with total installed capacity crossing 220 GW for the first time.
Q4: Has renewable energy investment surpassed fossil fuel investment? Yes—for the first time in 2025, global clean energy investment exceeded fossil fuel investment, a landmark milestone in the energy transition.
Q5: Is the world on track to meet its 2030 renewable energy targets? Progress is strong, but full decarbonization of electricity requires faster grid investment, storage deployment, and industrial sector action beyond current trajectories.
Conclusion
The renewable energy growth statistics for 2026 confirm what many hoped but feared might not come fast enough: the clean energy transition is real, it’s accelerating, and it’s economically unstoppable.
510 GW of solar in a single year. $2 trillion in clean energy investment. Renewables supply over a third of global electricity.
These renewable energy growth statistics aren’t just impressive data points — they represent the most significant transformation of the global energy system in human history. And it’s just getting started.